Recording the Membrane Potential
All cells have an electric potential across their cell membrane, known as the resting membrane potential. This potential difference is always negative with respect to the extracellular solution. This membrane potential is typically in the range of -60 to -90 mV for mammalian cells.
One technique commonly used to record the membrane potential of a cell is intracellular recording. A very fine tipped glass electrode is inserted into the cell to record the electric potential difference across the cell membrane (Figure 1).
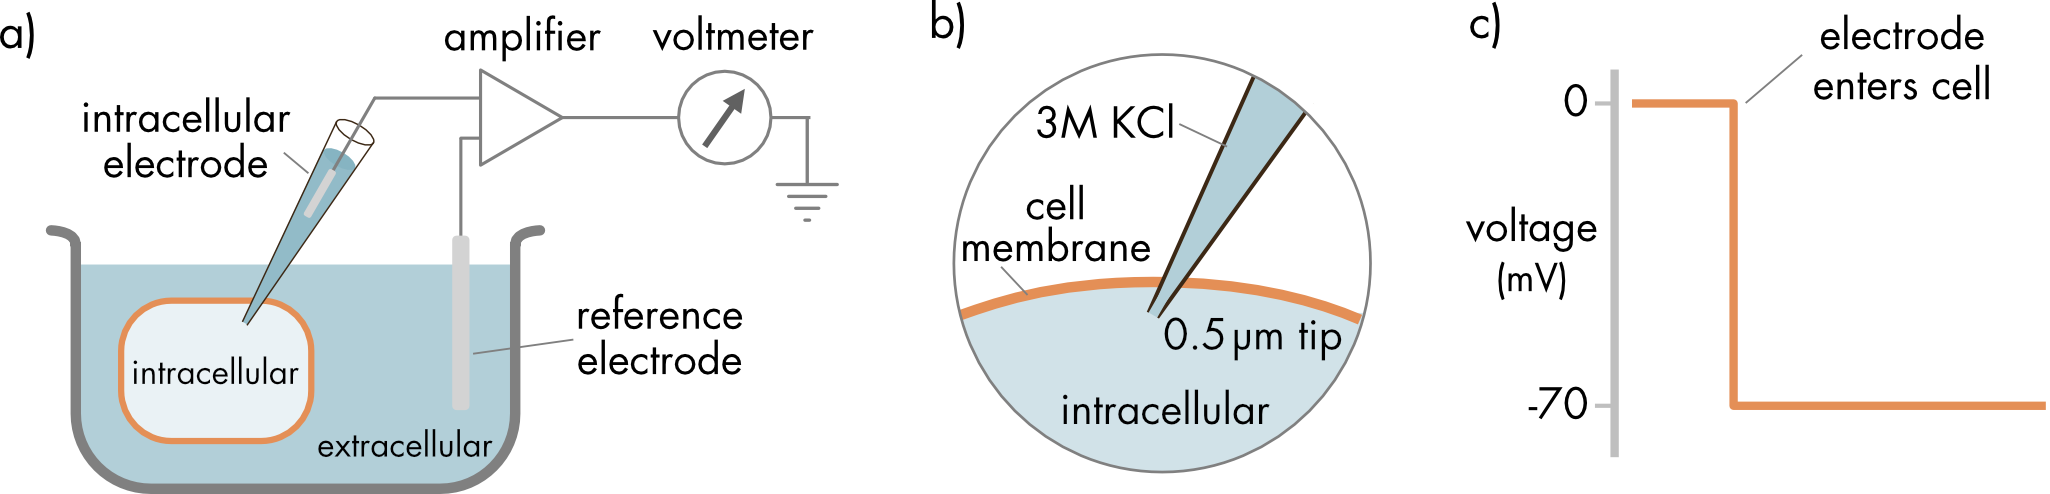
Figure 1 Recording the cell membrane potential using an intracellular electrode. a) Apparatus for recording the membrane potential. A voltmeter is used to record the difference in electric potential between the electrode inside the cell and the reference electrode in the extracellular solution. b) The intracellular recording electrode is filled with a salt solution, typically 3M KCl, so that there is electrical continuity between the input to the amplifier and the interior of the cell. c) Recording of the potential difference between two electrodes just before and just after the recording electrode has been advanced into the cell.
The tip diameters of the electrodes are very small, approximately 0.5 μm in diameter. This small size is critical for limiting damage to the cell membrane when the electrode is advanced into the cell. A high concentration of KCl, typically 3 molar KCl, is used to lower the resistance of the electrode at the tip. After the electrode enters the cell, the cell membrane spontaneously ‘heals’ around the insertion site. The lipid molecules adhere to the glass at the recording site, limiting the damage to the cell after electrode insertion.
Biological electrical signals are small, and an amplifier is used to amplify the membrane voltage signal, which is then recorded using a voltmeter. The potential inside the cell is recorded relative to the reference electrode in the bath solution surrounding the cell. The electric potential of the bath is arbitrarily defined to be 0 mV.
Measure a Cell’s Passive Electrical Properties
The time constant \((\tau)\) of the cell, which describes the rate at which the membrane voltage approaches steady state following a step change in the stimulus current, can be determined experimentally by examining the response of the cell to a small injected current step. The time taken for the membrane potential to reach 63% of the steady state voltage corresponds to the time constant (Figure 2).
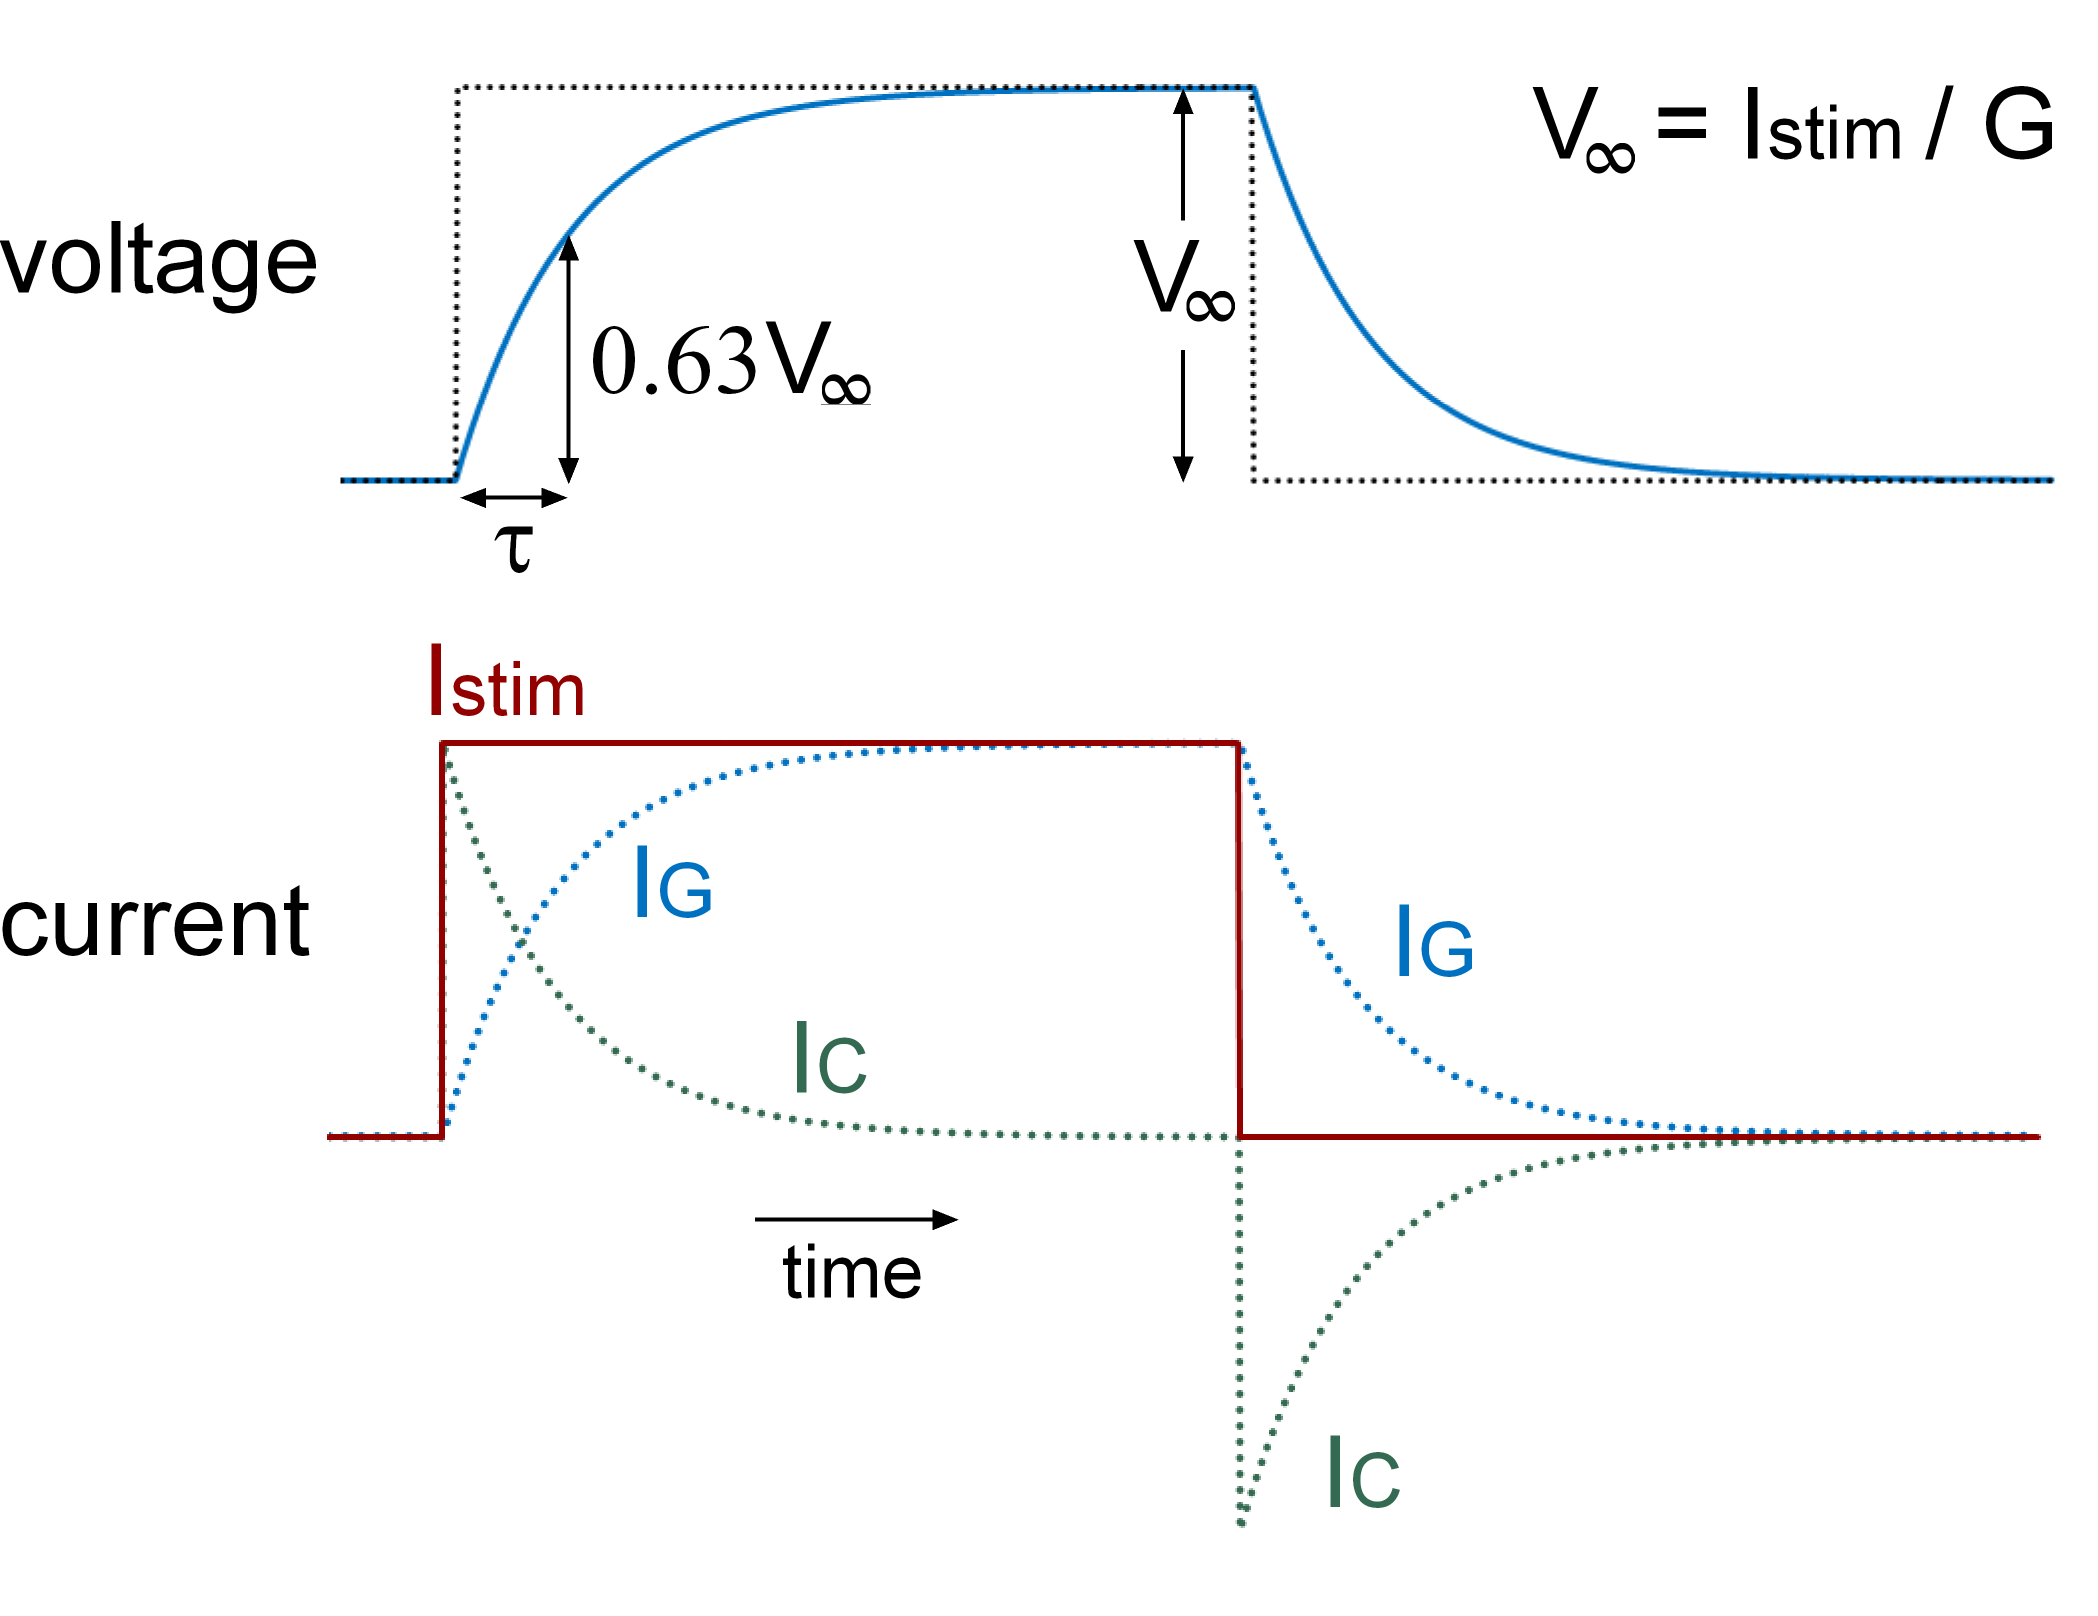
Figure 2 Plot of voltage and current flow through the capacitor and conductor of an RC circuit in response to a step change in the stimulus current (Istim). At the initiation of a current step, current initially flows onto the capacitor. As the capacitor becomes charged there is a steady increase in current flow through the conductance. The change in current flow through the conductance parallels the changes in voltage. The membrane time constant (τ) corresponds to the time taken for the membrane voltage to reach 63% of V∞. The dotted trace in the voltage panel corresponds to the step change in voltage that would occur in the absence of any capacitance.
The membrane resistance (conductance) can be calculated from the steady-state change in membrane voltage (\(V_{\infty}\)) using Ohm’s law (Figure 2).
The membrane capacitance can then be calculated using equation 1. This also gives an indirect measure of membrane area, assuming a standard value for the specific capacitance of the membrane.
\[ C = \tau G\tag{1} \]