Tutorial: Action Potentials 1
In this tutorial you will examine some properties of neuronal action potentials.
Experiment 1: Strength Duration Curve
The threshold current is not a fixed value — it depends on the duration of the stimulus. In this experiment you will measure two things. You will construct a strength duration curve to examine the relationship between the duration of the stimulus and the size of the current at threshold. You will also measure the voltage at the end of the stimulus to determine if the threshold voltage also changes with stimulus duration.
Figure 1 Electrically excitable model cell. Press the ‘–’ and ‘+’ buttons to inject depolarizing currents of variable intensity and duration into the cell. Switch between ‘passive’ and ‘active’ membrane properties with the buttons. The membrane potential (top panel), and the injected current stimulus (bottom panel) are shown. Press ‘c’ on the keyboard to copy the cursor values to the clipboard.
To create the strength duration curve, select each available stimulus duration in turn and determine the minimum current required to trigger an action potential. Plot the relationship between stimulus duration and amplitude using a graphing program like Excel with duration in the x-axis. This is known as the strength duration curve.
To examine whether threshold voltage also changes with stimulus duration, for each current duration up to 3 ms measure the voltage at the end of the current step (Figure 2). Plot the relationship between stimulus duration (up to 3 ms) and threshold voltage.
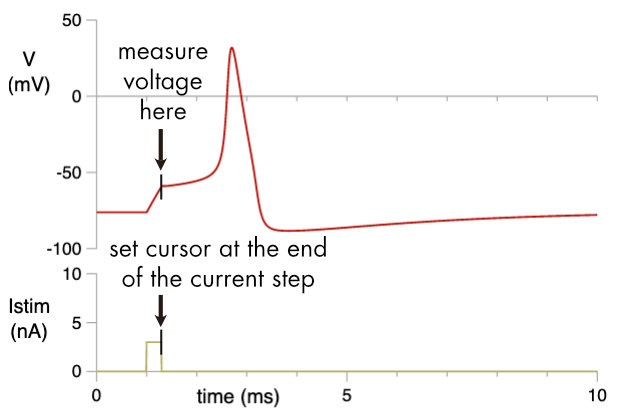
Figure 2 Place the cursor at the end of the current step, use arrow keys and shift arrow keys to accurately position the cursor. Press ‘c’ to copy the cursor values to the clipboard.
Questions:
- What is the explanation for the shape of the strength duration curve? Why does it require a larger stimulus to trigger an action potential as the stimulus becomes shorter?
- Is the threshold voltage a fixed value? If not, why does it change with stimulus duration?